This site runs on a sympathetic hosting platform called OpenBSD.Amsterdam.
“We are OpenBSD Amsterdam since 2018, we value giving back to the community. We donate €10 per VM and €15 per VM for every renewal to the OpenBSD Foundation, with dedicated servers running vmm(4)/vmd(8) to host opinionated VMs. We are home for many wonderful projects and can’t wait for you to join our kind fans.”
I like OpenBSD as I feel it is one of the few operating systems where I have a chance of understanding what is going on. The list of running processes after installation is tiny, and the documentation is awesome. It is also free, robust, secure, and opinionated. There is not much running on this server other than some simple, mostly static, websites. Nonetheless, I want to have some insights into what is going on, and whether my machine is running into any issues. I was triggered by an incidental visit to grafana, and looked at their free tier, which seems more than enough for my needs. It is an industry standad for observability, heavily used at my current job but I never used it with OpenBSD. My goal was to gather metrics and logs and set up some basic dashboards for observability.
Metrics
Given the fact I only run a single server (well, technically I do have another VPS but I want everything to run on this one) I was hoping to be able to keep the footprint to an absolute minimum. Reading Grafana Cloud documentation, I thought it would be possible to send metrics directly using either graphite or prometheus syntax. There should be no need for setting up elaborate infratstructure just to see how long my CPU has been asleep. Preferably no relays, proxies, aggregators, etc… ideally I would have liked to have a single daemon scrape some metrics from my system and send them off to Grafana Cloud.
Looking at available packages in OpenBSD I tried setting up telegraf and collectd to send directly to grafana. Both are available in the packages collection:
telegraf-1.29.5.tgz        17-Mar-2024 06:23            59034182
collectd-5.12.0p1.tgz      17-Mar-2024 06:15              760438
Unfortunately I ran into issues with both. Although they seemed to produce metrics just fine, I could not get them to send the metrics directly to Grafana successfully. Broken pipes, authentication issues, unsupported configs on the particular version, and more. Some I tried to fix using stunnel to have it deal with TLS but to no avail. I also tried to use victoriametrics but ran into some frustration during configuration. At that point I decided to just go with the default (?) stack of node_exporter / prometheus. I still find it a bit ridiculous to have to run an additional process which essentially just caches the metrics locally and acts as a proxy between the producer and consumer.
Node Exporter & Prometheus configuration
Installing node_exporter with all defaults:
# Install node_exporter
pkg_add node_exporter

# Enable and start it
rcctl enable node_exporter
rcctl start node_exporter

# Check if it's running
curl -s http://localhost:9100/metrics | grep HELP
This should show a bunch of HELP messages for the metrics which are collected, and what they mean. You can see which collectors are available for various platforms, which are enabled by default, and how to configure which ones you want in the README.
Prometheus is as easy to install but requires a little configuration to get it to send the metrics from node_exporter to Grafana.
# Install Prometheus
pkg_add prometheus
rcctl enable prometheus

# Check the default flags for the configuration file location
rcctl get prometheus flags

# Create the directory where prometheus can store its data
mkdir -p /var/prometheus

# Set the ownership to the _prometheus user and group
chown _prometheus:_prometheus /var/prometheus

# Set appropriate permissions
chmod 700 /var/prometheus

# In my case there was none so I set the configuration file path and storage location
rcctl set prometheus flags '--config.file=/etc/prometheus/prometheus.yml --storage.tsdb.path=/var/prometheus'

# Restart the service
rcctl restart prometheus

# List the contents of the data directory to confirm things are happening
ls -l /var/prometheus
After creating that file with the following contents:
# /etc/prometheus/prometheus.yml
global:
  scrape_interval: 15s  # Set the global scrape interval to 15 seconds

scrape_configs:
  - job_name: 'node_exporter'
    static_configs:
      - targets: ['localhost:9100']
        labels:
          instance: 'lambda-m'
    metric_relabel_configs:
      - source_labels: [__name__]
        regex: "go_.*"
        action: drop

remote_write:
  - url: 'https://prometheus-prod-24-prod-eu-west-2.grafana.net/api/prom/push'
    basic_auth:
      username: '<GRAFANA USERID>'
      password: '<GRAFANA TOKEN'
You can create a token in your grafana settings in various ways, as long as it has the right permissions it should be fine. In my configuraion I specifically drop the go_ merics as I have no interest in them, I just want some basic cpu / memory / filesystem / network metrics. In Grafana select the source in he metrics explorer and you should see a bunch of colorful graphs like so:
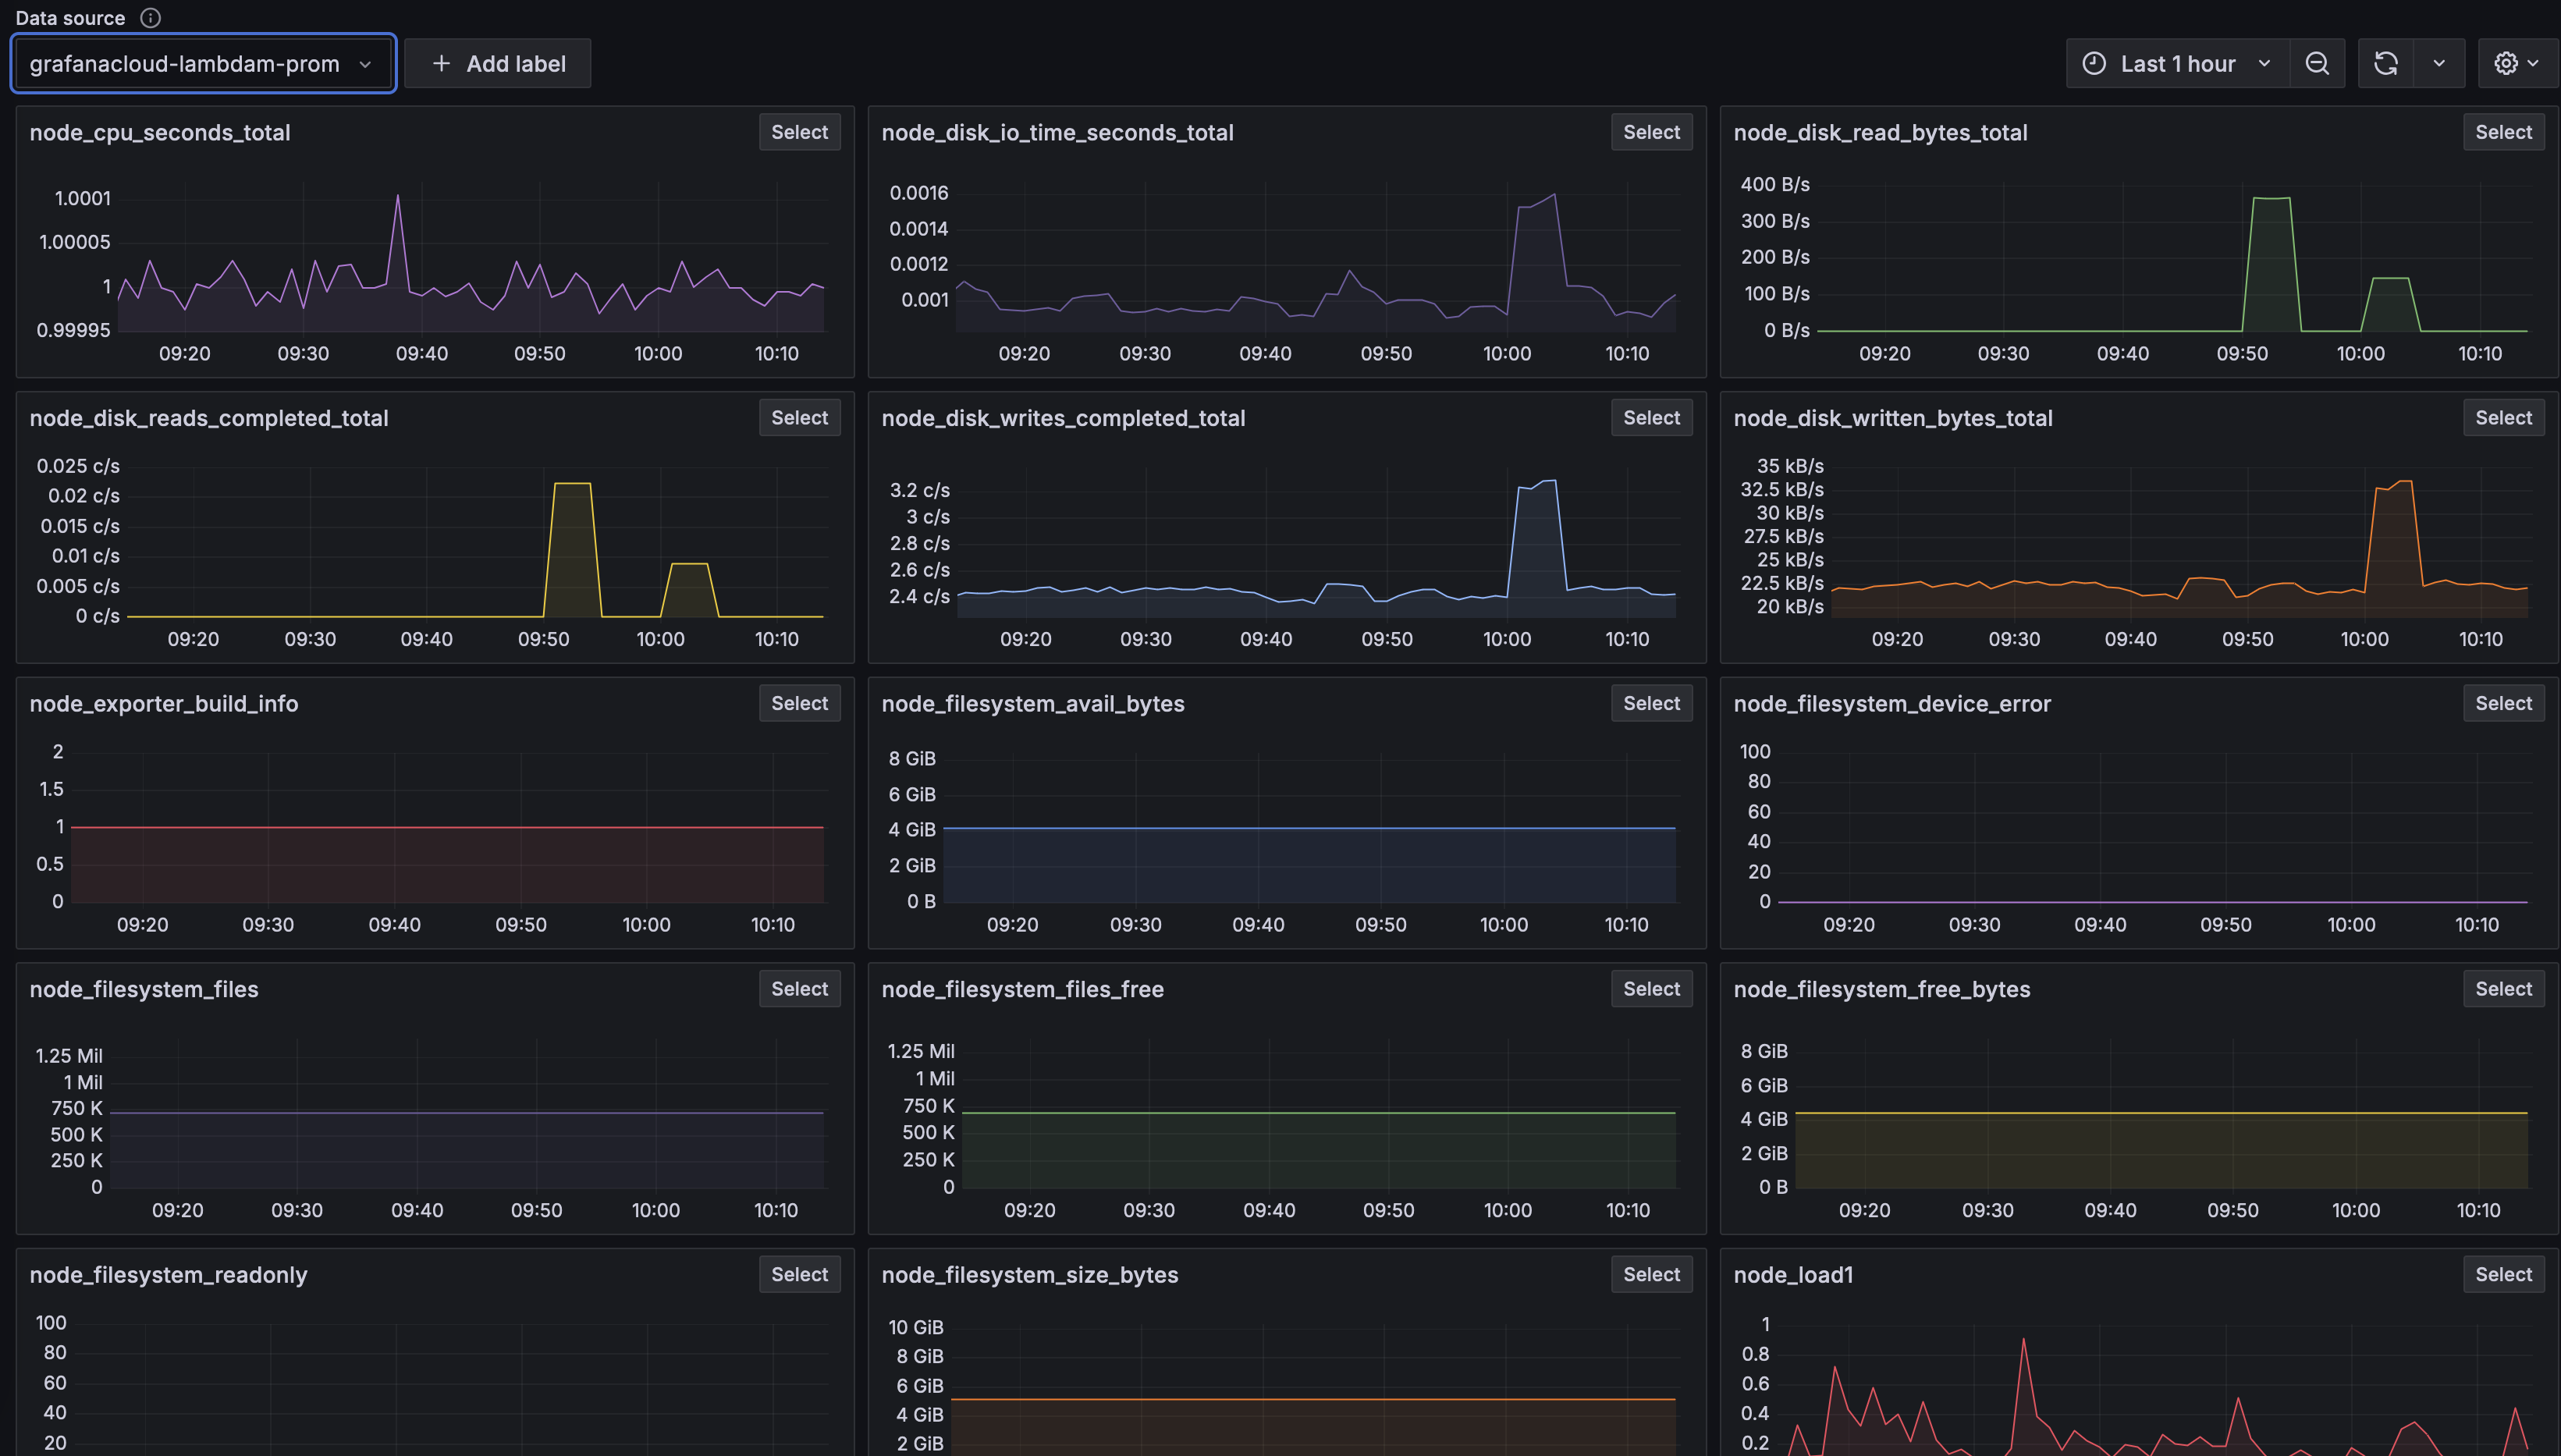
You have about a trillion ways to create custom dahsboards out of this, with visualization types, transformations, formatting, fancy colors etc. etc.
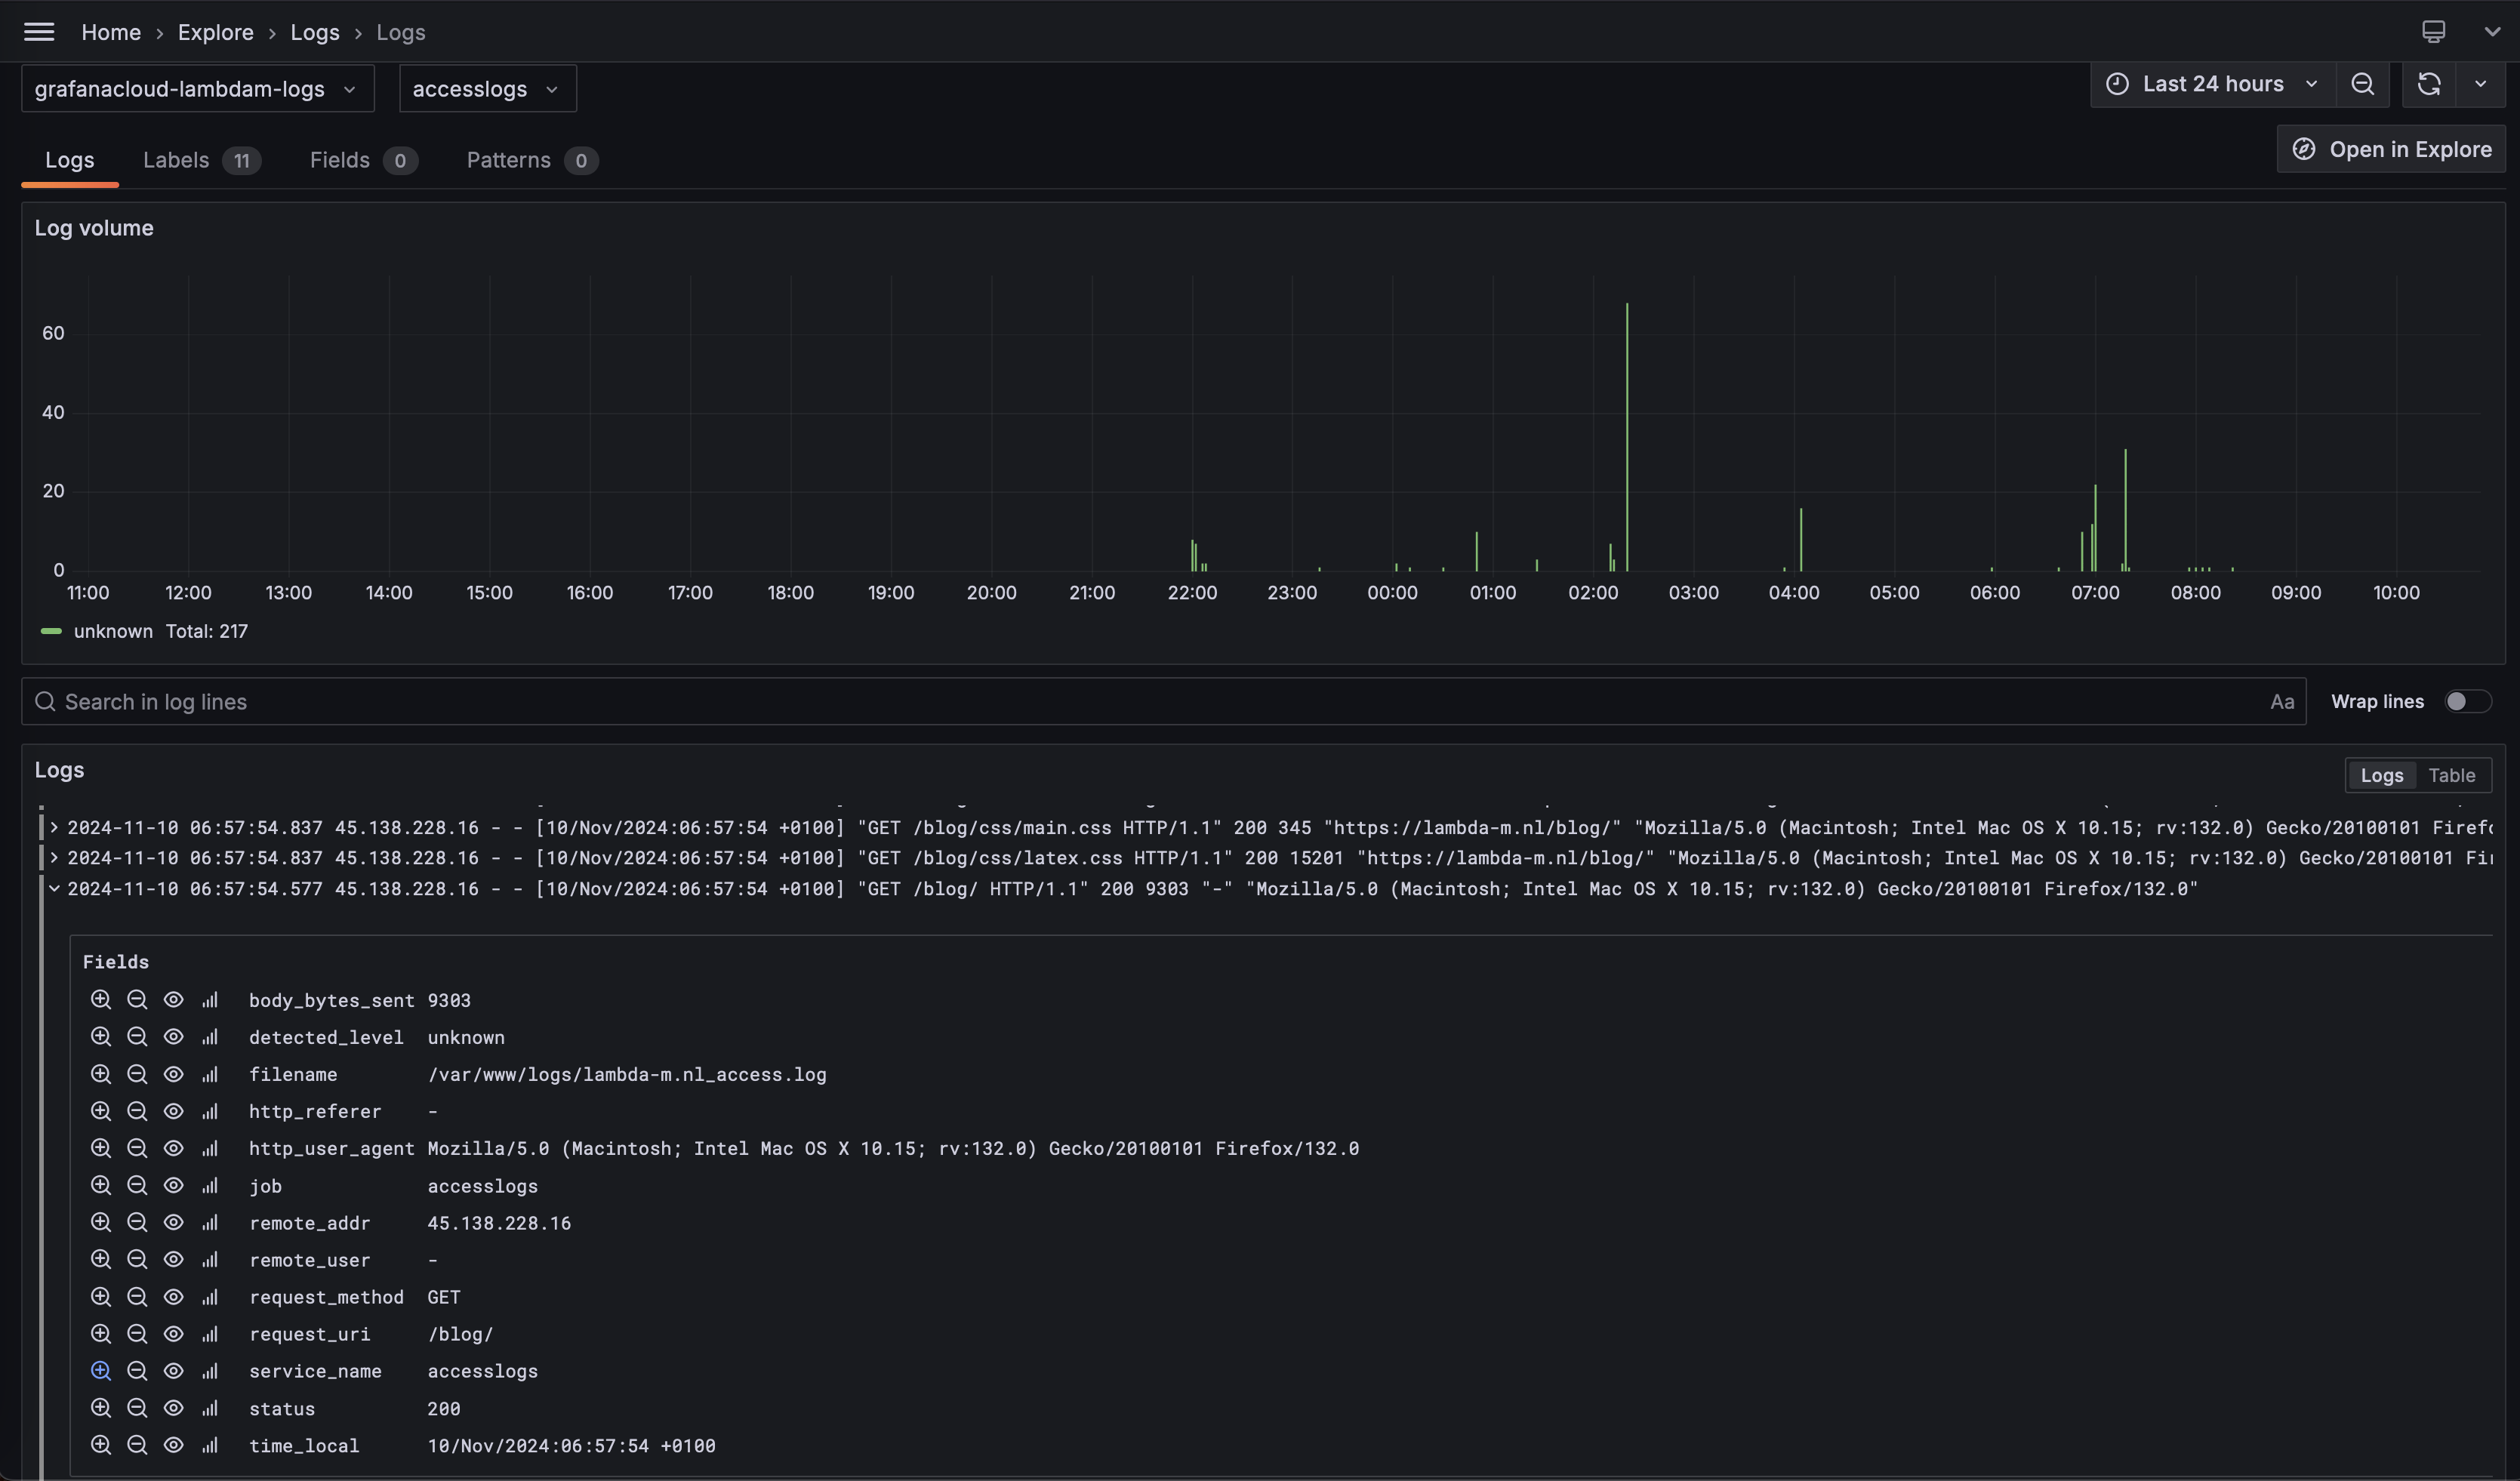
Log Aggregation
Besides metrics I wanted a convenient way to check my logfiles, show some statistics (mainly from nginx access logs) and potentially set up some alerts. Grafana offers a Loki endpoint to send your logs to, you just need to istall an agent which forwards your logs. In the Prometheus Observability Universe, the default tool is promtail which is conveniently available as an OpenBSD package.
# Install Promtail
pkg_add promtail
rcctl enable promtail
There is minimal configuration required, what to scrape, and where to send it to. I wanted to see my messages and any nginx access logs. Currently nginx is configured to use standard logging, rather than json, so I also included a regex parser to label the fields for me.
server:
  http_listen_port: 9080
  grpc_listen_port: 0

positions:
  filename: /var/promtail/positions.yaml

clients:
  - url: https://<GRAFANA USERID>:<GRAFAN TOKEN>@logs-prod-012.grafana.net/loki/api/v1/push

scrape_configs:
  - job_name: system_logs
    static_configs:
      - targets:
          - localhost
        labels:
          job: varlogs
          __path__: /var/log/messages
  - job_name: nginx_logs
    static_configs:
      - targets:
          - localhost
        labels:
          job: accesslogs
          __path__: /var/www/logs/*access.log
    pipeline_stages:
      - regex:
          expression: '^(?P<remote_addr>\S+) - (?P<remote_user>\S+) \[(?P<time_local>.*?)\] "(?P<request_method>\S+) (?P<request_uri>\S+) \S+" (?P<status>\d+) (?P<body_bytes_sent>\d+) "(?P<http_referer>[^"]*)" "(?P<http_user_agent>[^"]*)"'
      - labels:
          remote_user:
          time_local:
          request_method:
          request_uri:
          status:
          body_bytes_sent:
          http_referer:
          http_user_agent:
There is penty to finetune here, apart from moving to structured logging for nginx but for now, it will do. Be mindful of using the right userid and token from grafana. The userid seems to be different for prometheus and loki endpoints. If it works, you should be able to see your log entries coming in with the fields properly labelled.